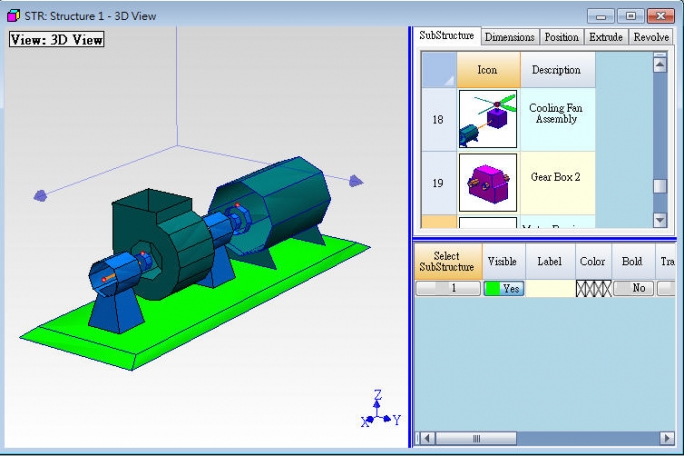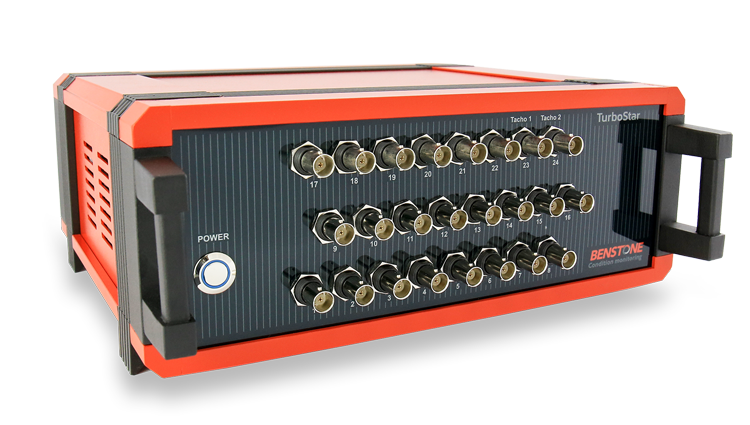
TurboStar Turbomachinery Health Condition Monitoring and Analyzing System
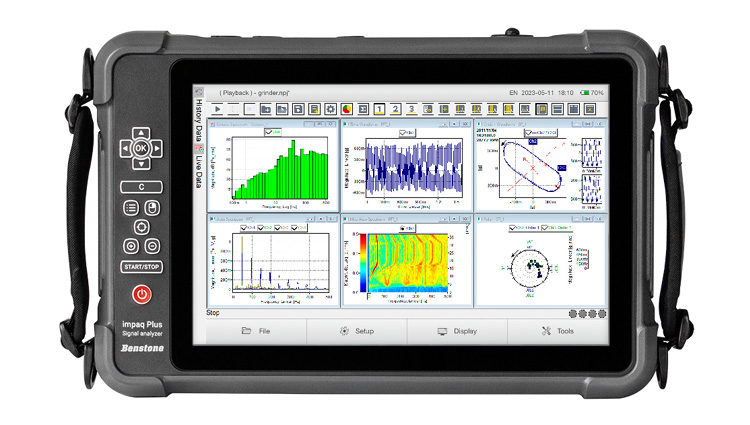
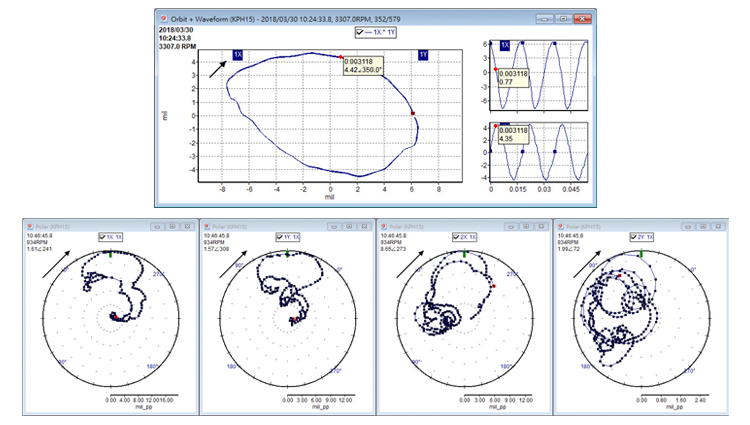
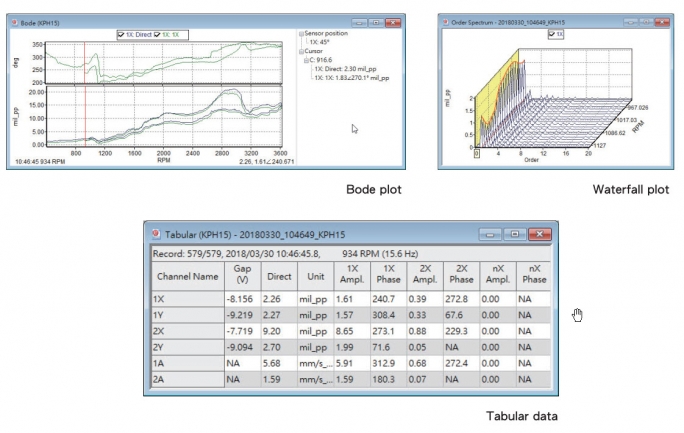
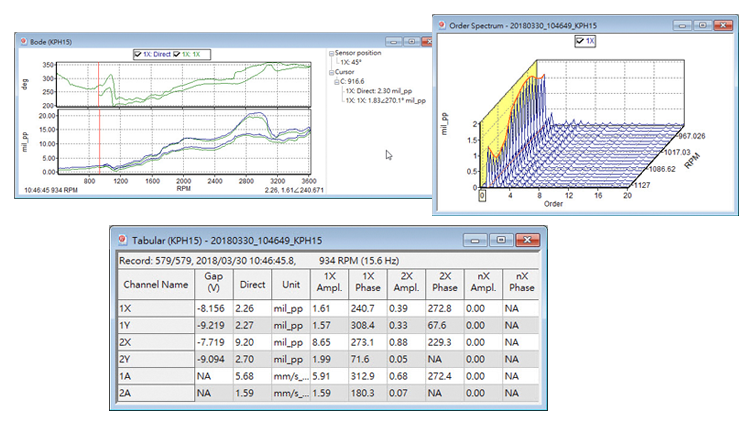
The interface is very simple and intuitive for most engineers. This means that you can operate in the field without making mistakes due to complicated setup operations. Yet it provides all the measurement information, such as waveform plot, spectrum plot, bode plot, polar plot (polar plot), orbit plot, filtered orbit plot, shaft centerline plot, trend plot, tabular, etc., for engineers to use for diagnostic analysis.
Use local database to storage data
TurboStar uses local databases for data storage. During the measuring process, everything is saved immediately. This means that stored data remains safe even when a power shortage causes the system or PC to shut down. For long-time measurement, TurboStar can set up automatic saving. So even cases of heavy data will not lead to any memory or resource shortages, and no measurement data will be lost. As for discontinuous data caused by heavy data, the program provides a file merge function for further data processing.
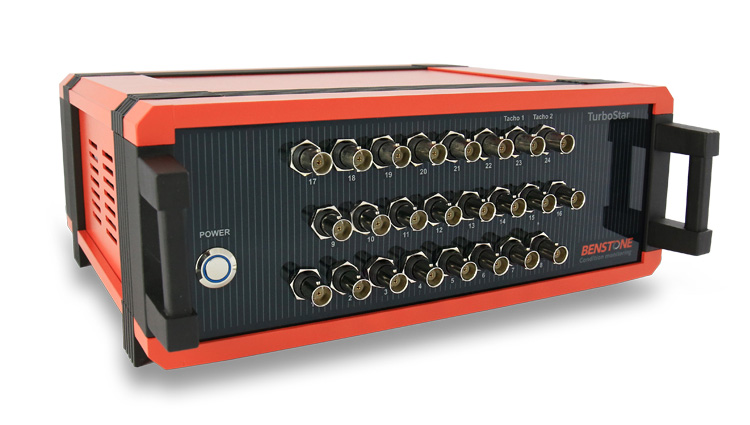
Support 2 independent tachometer
TurboStar allows the connection of up to two tachometers and the simultaneous generation of two separate sets of data in real time based on different speed signals. This feature is useful for some units that need to perform parallel calculations with reference to different axis speeds before they can be connected in parallel.
Absolute phase measurement
TurboStar is able to provide accurate measurement data, especially for the vibration phase angle, using the high spot absolute phase algorithm. The resulting data from that process is comparable to the most common systems on the market. This is especially important for vibration engineers to balance the rotor in the field.
- Dynamic balance
- Vibration online monitoring